Integrate with Datadog
Datadog is a cloud monitoring and analytics platform that provides real-time insights into application performance, infrastructure, and log management. By integrating Zilliz Cloud with Datadog, you can send metric data about your Zilliz Cloud clusters to your Datadog dashboards.
This feature is available only to Dedicated clusters in an Enterprise project.
Before you start
-
To integrate with Datadog, you must have Organization Owner or Project Admin access to the project. If you do not have necessary permissions, contact your Zilliz Cloud administrator.
-
You must have a Datadog account and a Datadog API key. For information on how to access your API key, refer to API and Application Keys.
Procedure
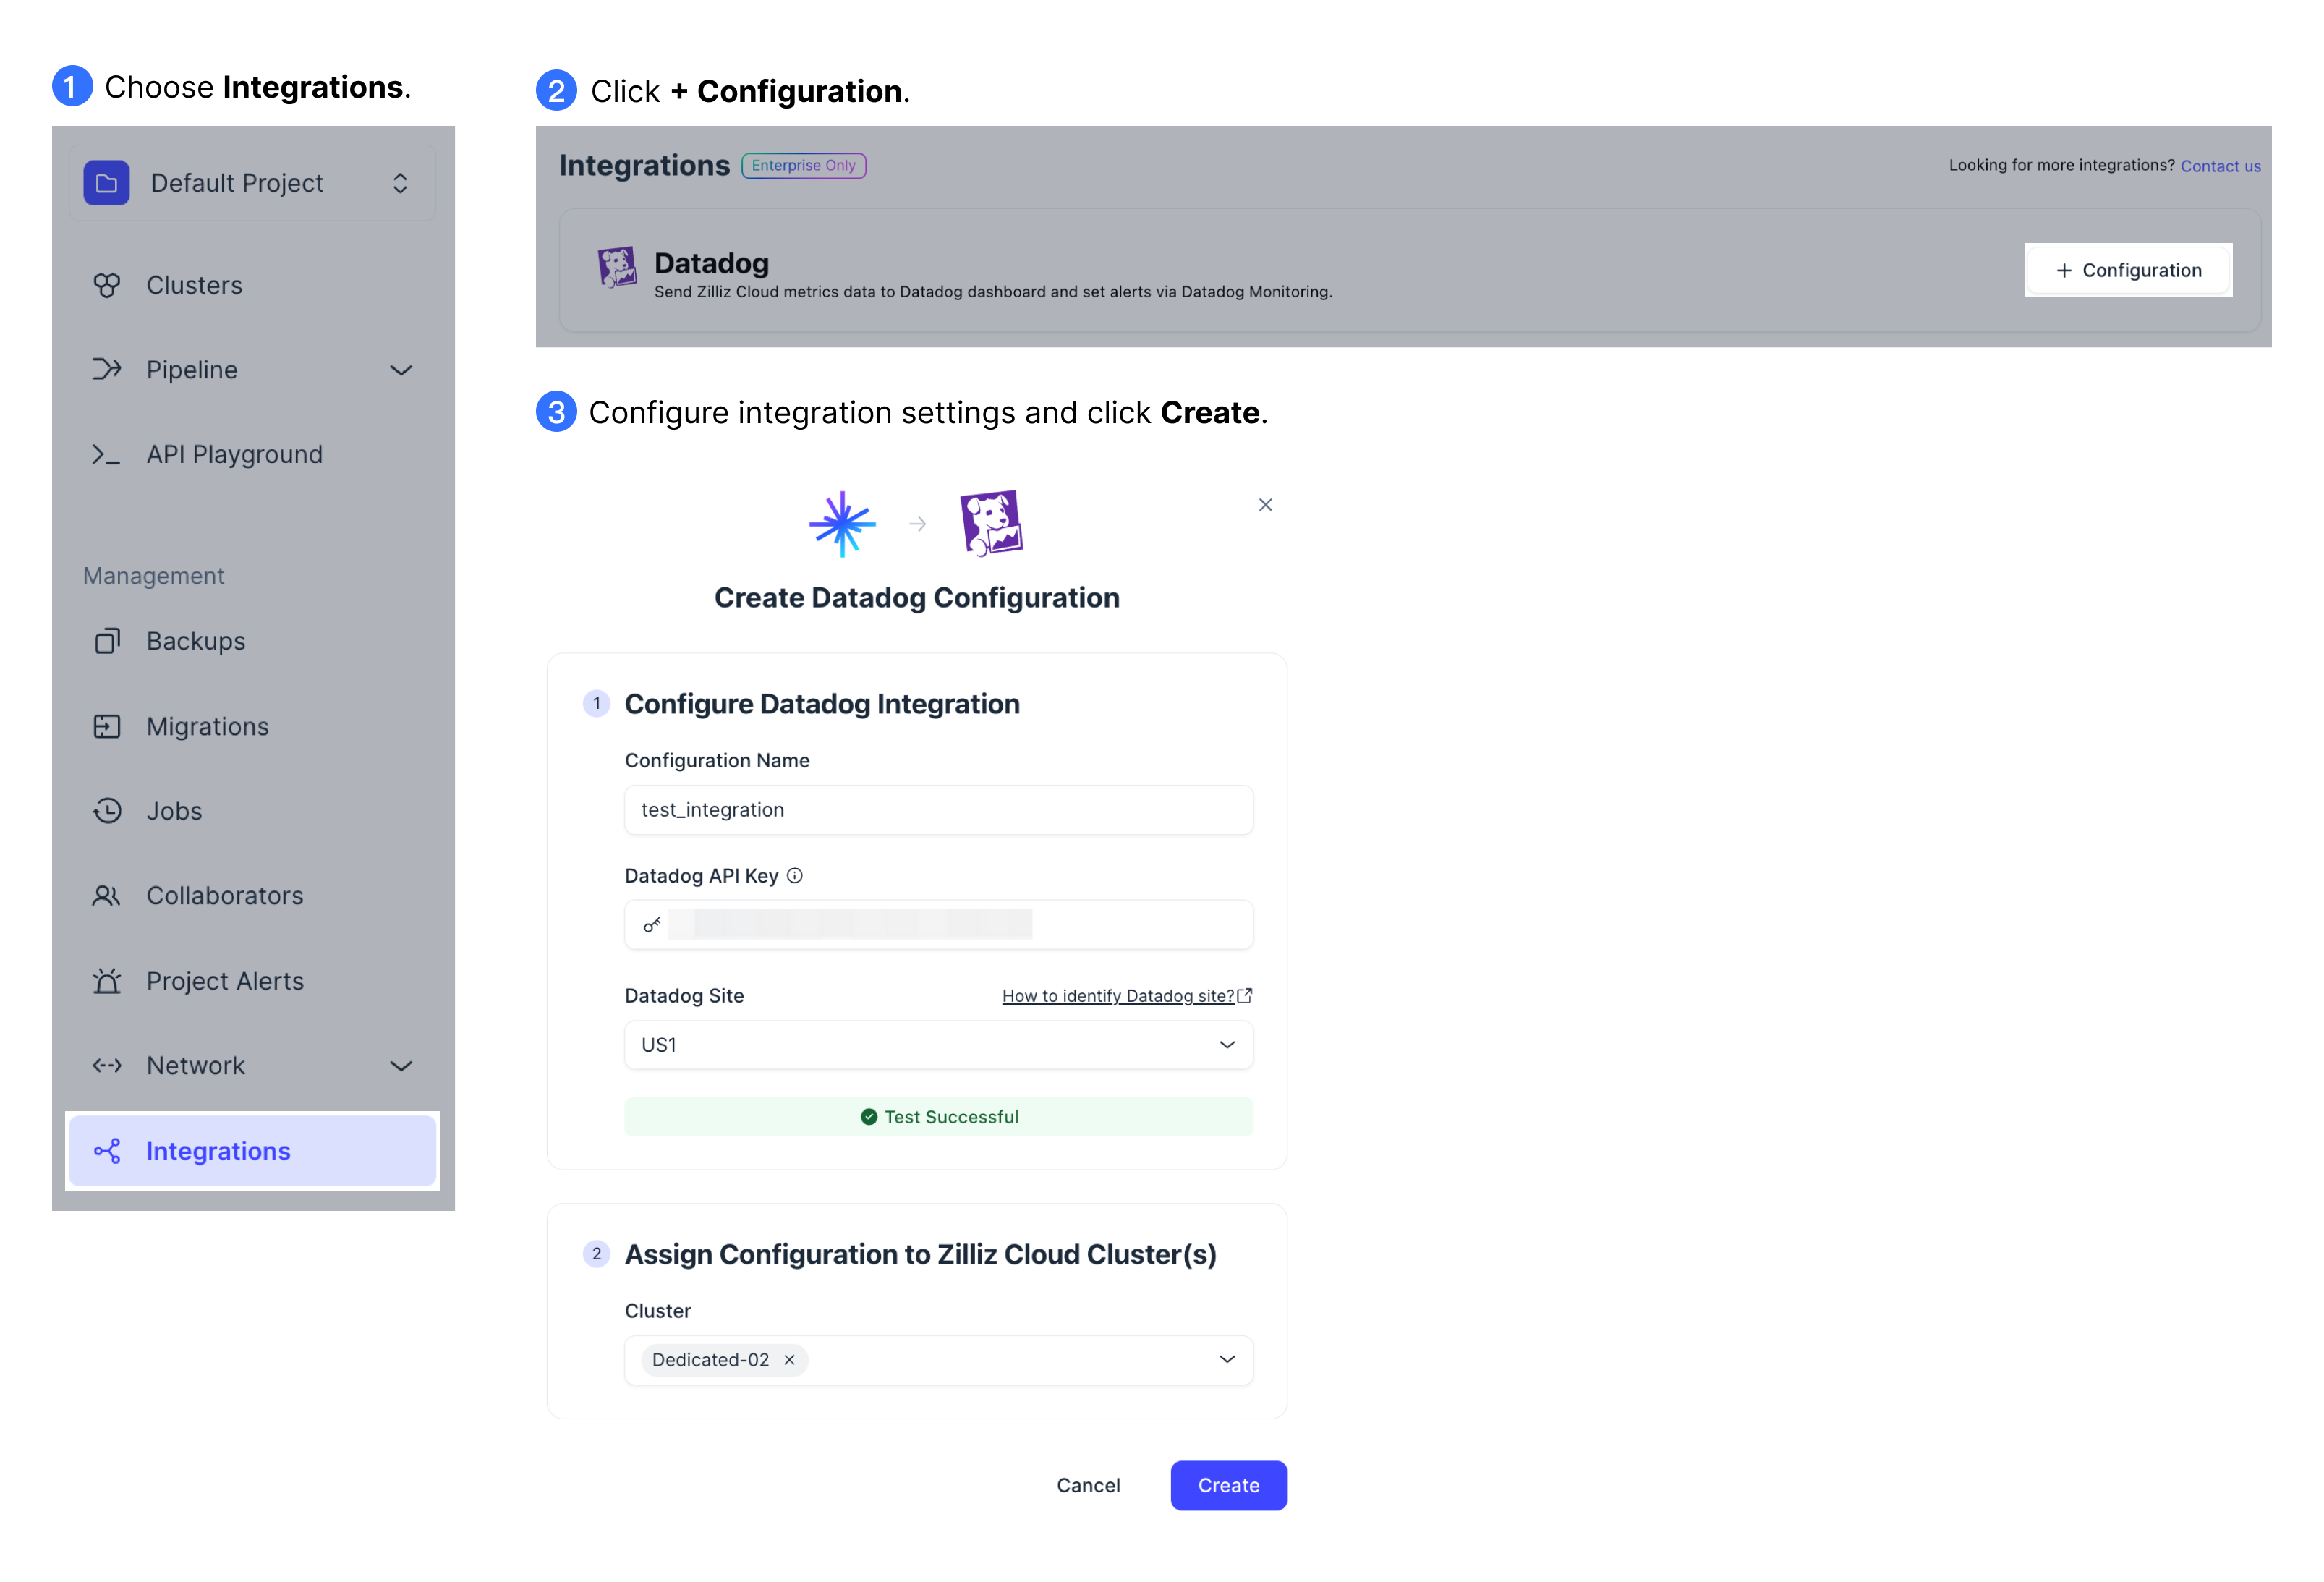
Log in to the Zilliz Cloud console.
In the left-side navigation pane of the project page, click Integrations.
Locate the Datadog section and click + Configuration next to it.
In the dialog box that appears, link Datadog to your project and assign clusters to collect metric data.
-
In the Configure Datadog Integration step, configure Datadog settings.
-
In Configuration Name, Enter a name for the integration (e.g.,
DG_configuration). -
In Datadog API Key, enter your Datadog API key.
-
In Datadog Site, select your Datadog site. Zilliz Cloud supports the following Datadog sites:
Site Site URL Site Parameter Location US1https://app.datadoghq.comdatadoghq.comUS US3https://us3.datadoghq.comus3.datadoghq.comUS US5https://us5.datadoghq.comus5.datadoghq.comUS EU1https://app.datadoghq.eudatadoghq.euEU (Germany) AP1https://ap1.datadoghq.comap1.datadoghq.comJapan For details on Datadog sites, refer to Access Datadog Sites.
-
Click Test Integration to verify the connection between Zilliz Cloud and Datadog. If the test is successful, proceed to assign clusters.
-
-
In the Assign Configuration to Zilliz Cloud Cluster(s) step, select one or more clusters from which metric data will be pushed to Datadog.
NotesOnly clusters of the Dedicated-Enterprise plan tier can be selected.
-
Click Create.
Monitor integration progress
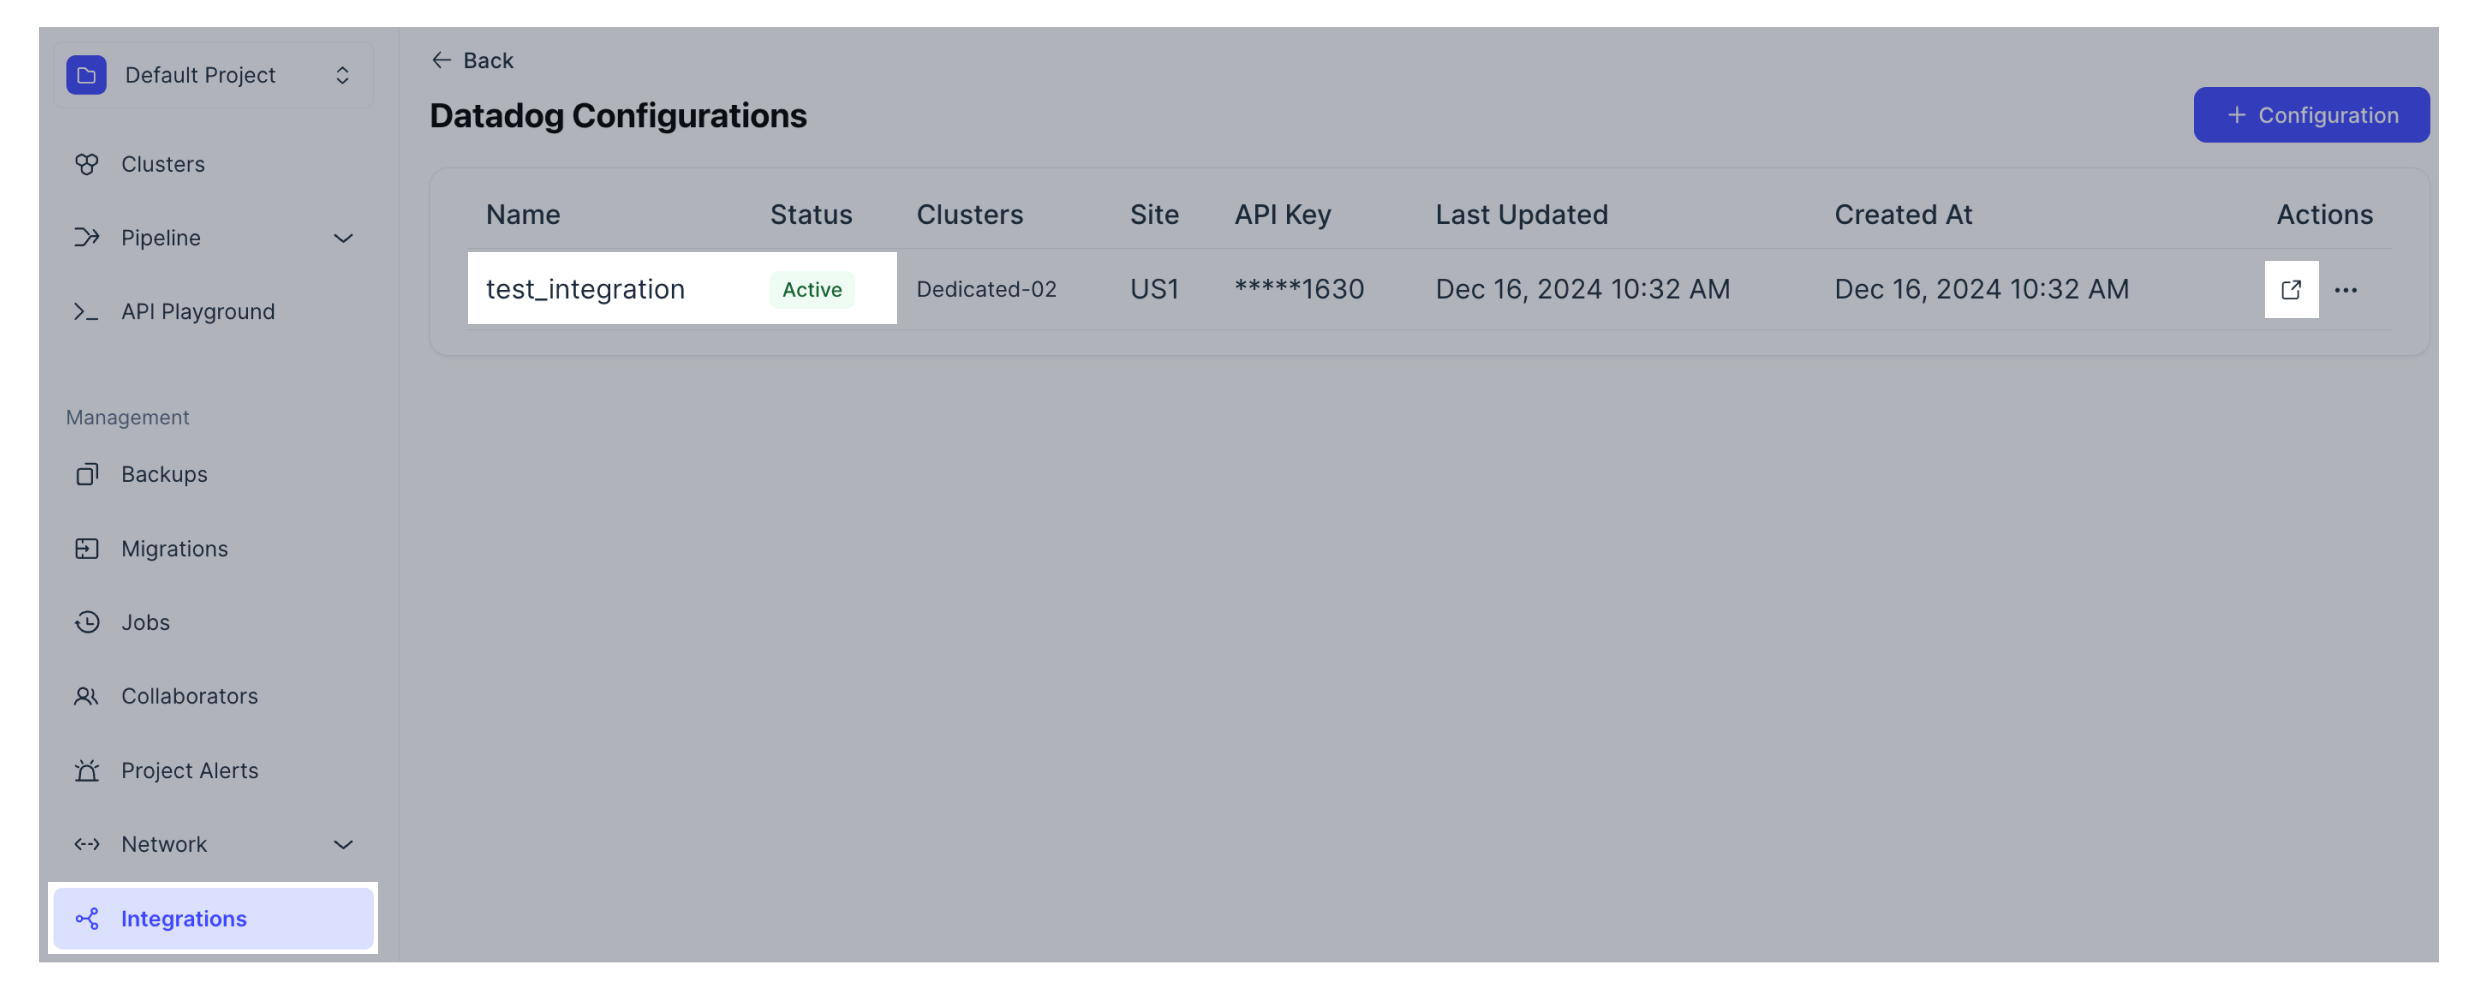
After setup, return to the Integrations page and verify that your Datadog integration is listed with the provided configuration details. If the status changes to Active, the integration is successful. Zilliz Cloud pushes data to Datadog at a minute-level frequency, ensuring near real-time updates.
By clicking the external link icon next to the integration, you can open the associated Datadog dashboard to view cluster metrics that are pushed from the selected Zilliz Cloud clusters.
Manage integrations
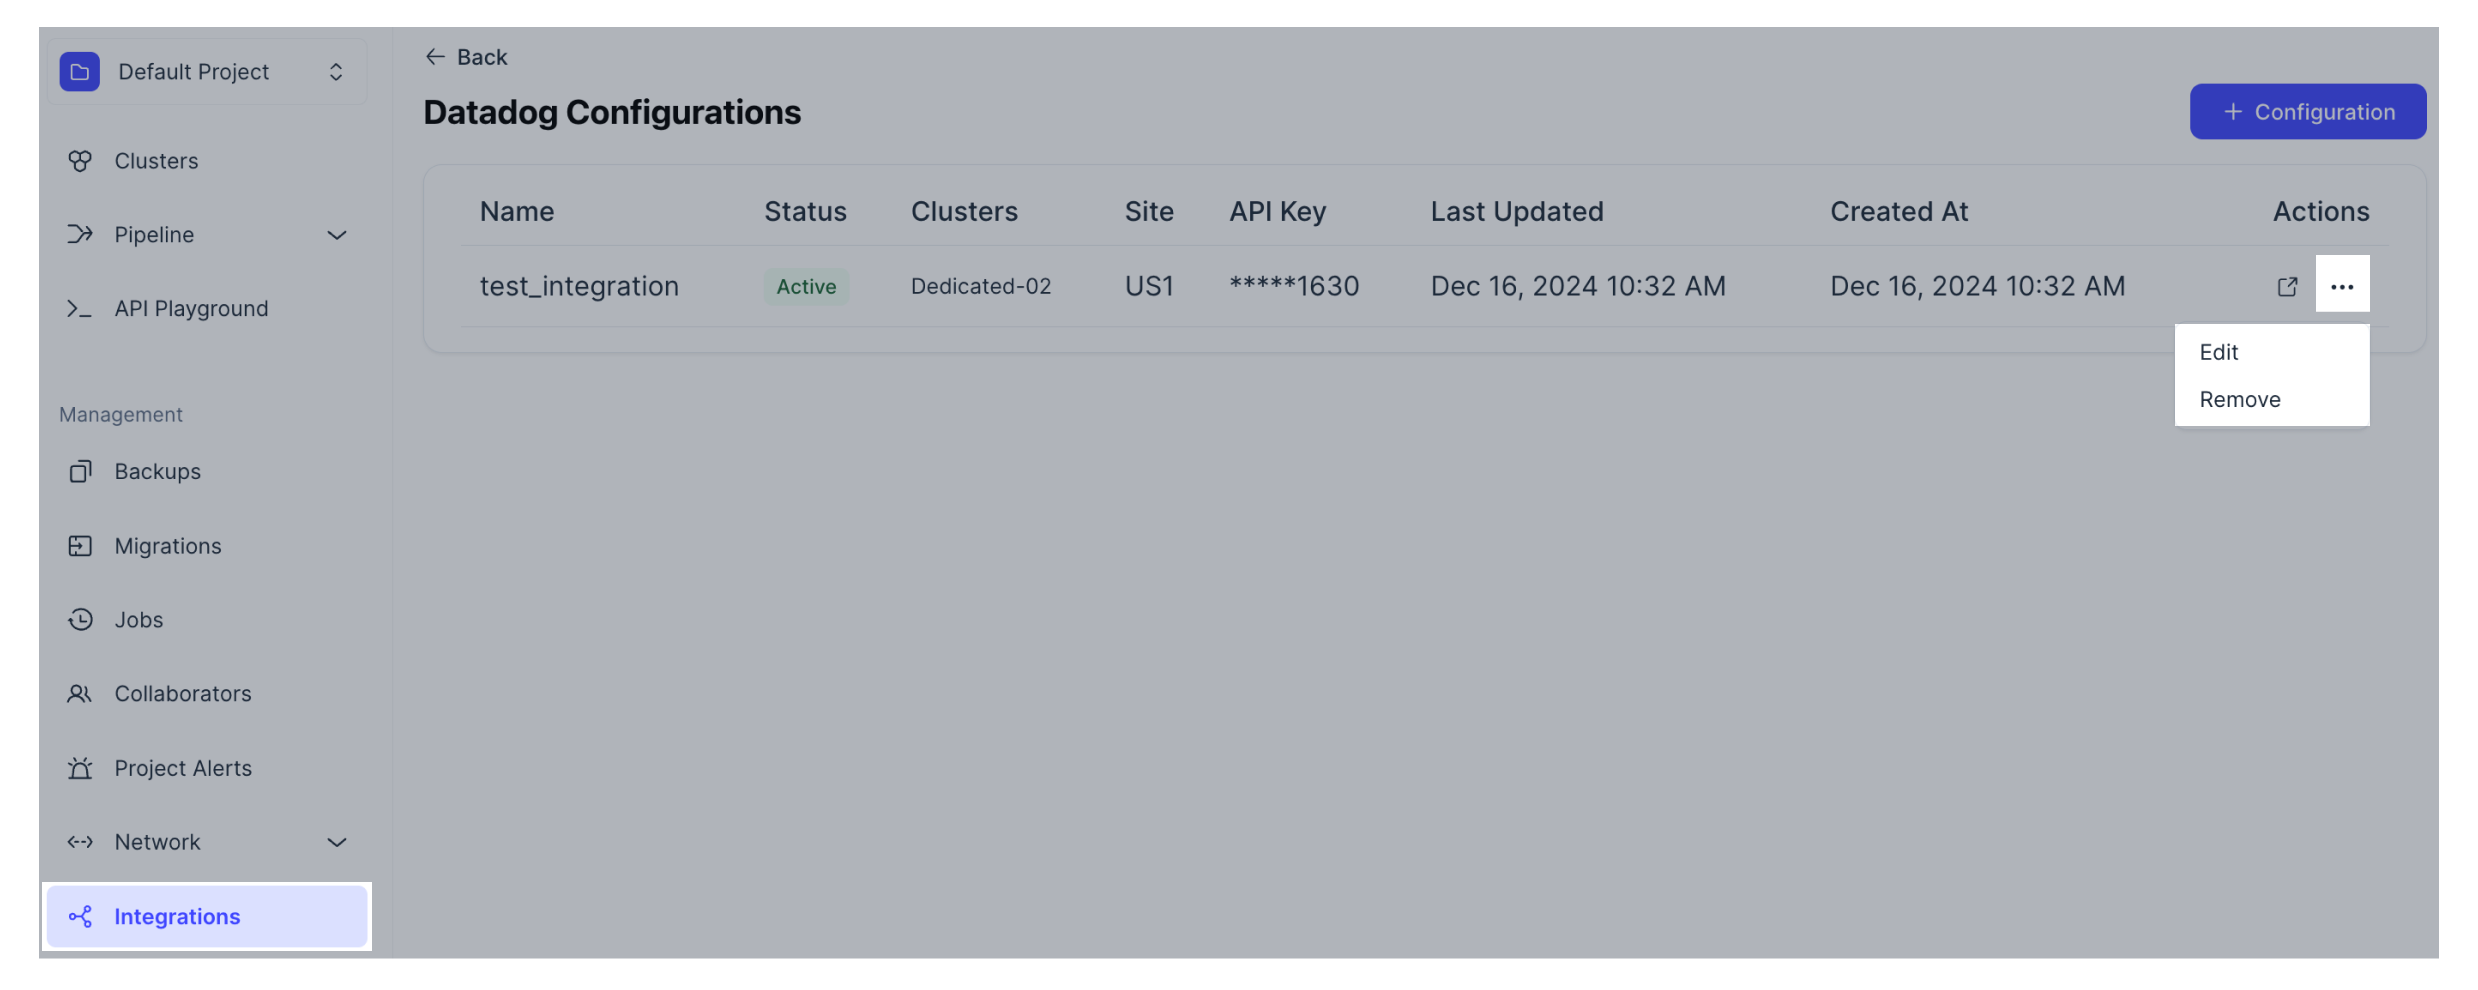
To manage your Datadog integration, use the Actions column:
-
Edit: Update the monitoring cluster or modify integration settings as needed.
-
Remove: Delete the integration if it is no longer required.
Performance metrics available to Datadog
Datadog tracks the following metric data for your Zilliz Cloud cluster. The metric names in parentheses are the names used in the Datadog UI.
Resource
| Metric Name | Metric Type | Description |
|---|---|---|
| CU Computation ( zilliz.cluster.cu.computation.current) | Gauge | A measure of the used capacity relative to the total capacity of the CU. Range from 0 to 1. |
| CU Capacity ( zilliz.cluster.cu.capacity.current) | Gauge | A measure of the utilized computational power relative to the total computational capacity of the CU. Range from 0 to 1. |
| Storage ( zilliz.cluster.storage.bytes.current) | Gauge | The total amount of persistent storage consumed by data and indexes. |
Performance
| Metric Name | Metric Type | Description |
|---|---|---|
| Cluster Write Performance Capacity ( zilliz.cluster.write.performance.capacity.current) | Gauge | A measure of the current rate of write operation relative to the write rate limit. Range from 0 to 1. |
| Slow Query Count ( zilliz.request.slow.queries.total) | Count | The total number of slow query requests. |
| QPS, Request Failure Rate, Number of Flush Operations ( zilliz.requests.total) | Count | The total number of requests processed. |
| VPS ( zilliz.request.vectors.total) | Count | The total number of vectors manipulated across all requests. |
| Latency ( zilliz.request.latency.milliseconds.average, zilliz.request.latency.milliseconds.p99) | Gauge | The average/P99 latency of requests processed. |
Data
| Metric Name | Metric Type | Description |
|---|---|---|
| Entity Count ( zilliz.entities.current) | Gauge | The number of entities. |
| Loaded Entities ( zilliz.loaded.entities.current) | Gauge | The number of loaded entities. |
| Collection Count ( zilliz.collections.current) | Gauge | The number of collections. |
| Number of Unloaded Collections ( zilliz.unloaded.collections.current) | Gauge | The number of unloaded collections. |
Tags available to Datadog
Datadog sends the following tags on certain metrics to help you better understand, organize, and identify resources.
| Tag Name | Description |
|---|---|
org_id | The ID of the Zilliz Cloud organization associated with the metric. |
project_id | The ID of the Zilliz Cloud project associated with the metric. |
cluster_id | The ID of the Zilliz Cloud cluster associated with the metric. |
request_type | The type of operation that is being monitored. Possible values: insert, upsert, delete, bulk_insert, flush, search, query |
status | The outcome of the operation. Possible values: success, fail |