View Cluster Metric Charts
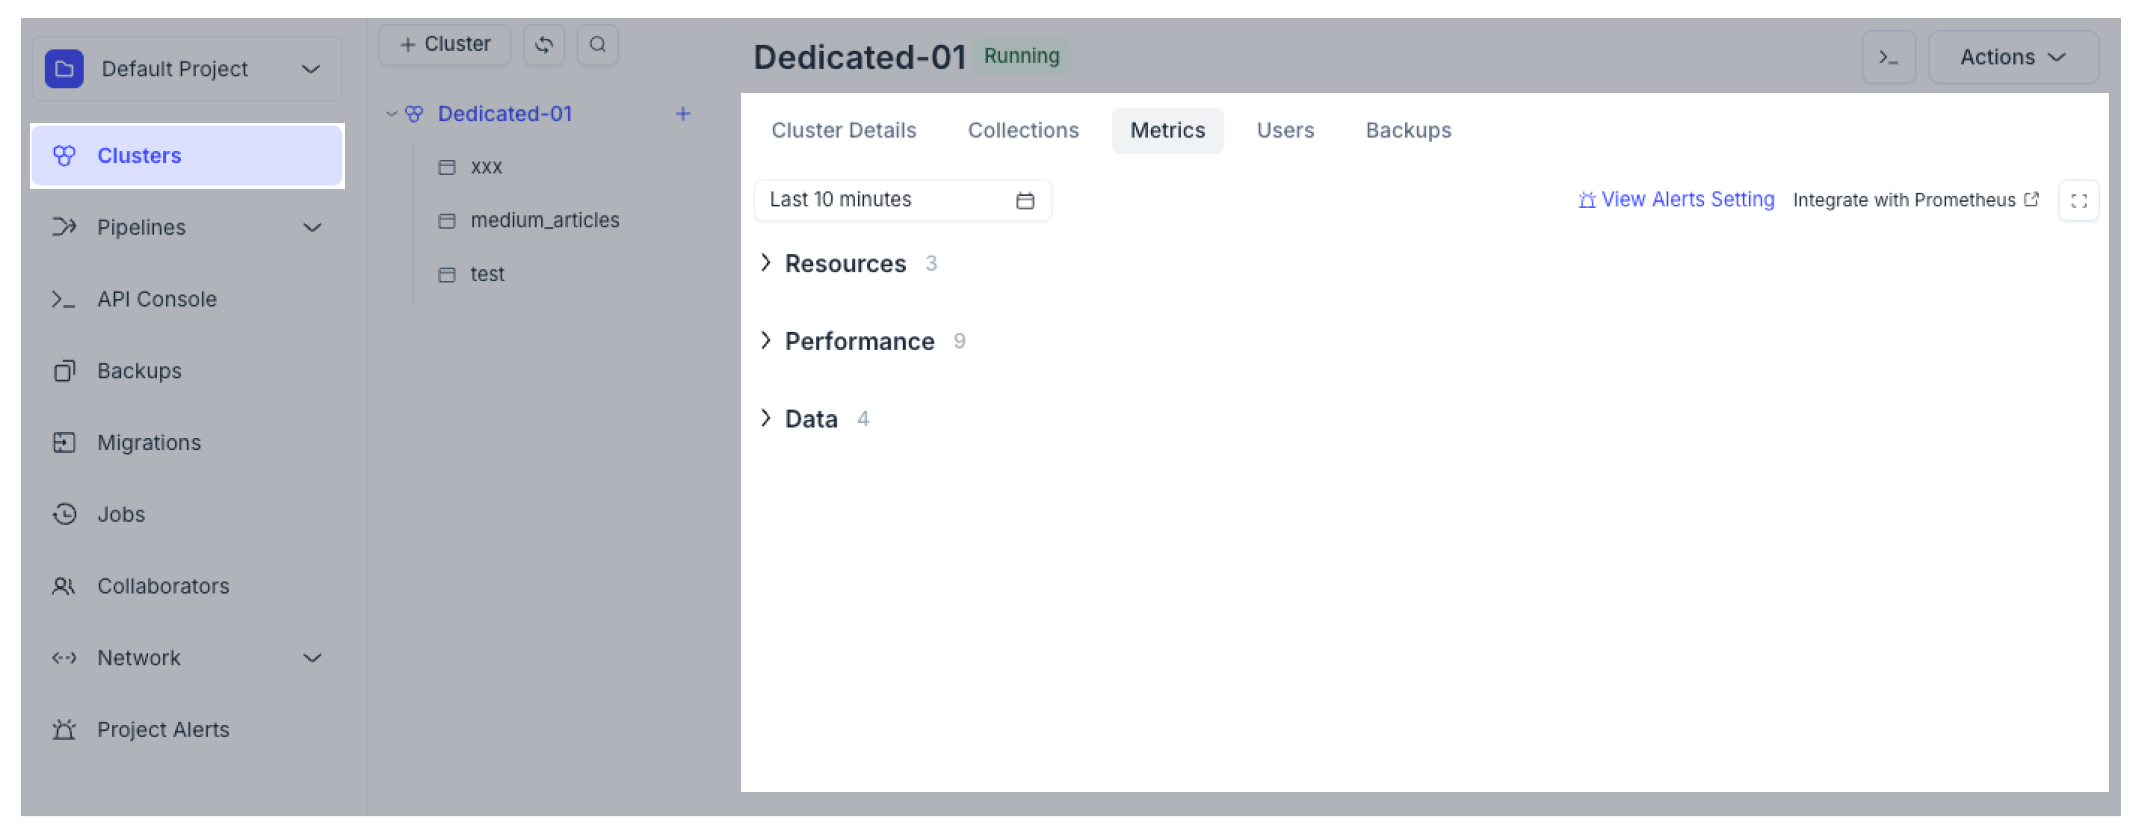
Zilliz Cloud offers a dashboard for observing cluster-specific metrics. To access this feature, navigate to the Metrics tab within one of your clusters.
For free clusters, only read & write vCUs are available. To unlock a range of advanced metrics, upgrade your plan tier.

Access cluster metric charts
In the Zilliz Cloud console, locate the target cluster and select the Metrics tab.
Zilliz Cloud's metric charts provide performance data on resource usage, queries per second (QPS), request results, and data operations, offering granular analysis within a specific time range.
Clicking View Alerts Settings on the right will redirect you to the Alert Settings page, offering a shortcut to manage your alerts.
For details on each metric chart, refer to View metric charts.
Modify curve window size
The Metrics tab allows for two types of window sizes.
-
Relative Range: Choose from a set of pre-defined time periods relative to your current time. Using relative time ranges allows you to check metrics in a periodical and convenient way, without needing to enter the specific start and end time. Your choices include:
-
Last 10 minutes
-
Last hour
-
Last 6 hours
-
Last 12 hours
-
Last day
-
Last week
-
Last month
-
-
Absolute Range: Enter the exact start time and end time. Using absolute range allows you to control the metrics you see in a more fine-tuned way.
- The time difference between the start and the end time should be greater than 10 minutes.
View metric charts
Zilliz Cloud offers metric charts for monitoring cluster performance from various aspects.
Resources
To view metric charts for resource usage, select the Metrics tab and refer to the Resources area. These charts provide a snapshot of the cluster's resource usage, including computation, capacity, and storage. For a quick overview of available metrics, refer to Metrics & Alerts Reference.
Performance
To view metric charts for performance, select the Metrics tab and refer to the Performance area. These charts provide a snapshot of cluster performance, including QPS, VPS, latency, and request. For a quick overview of available metrics, refer to Metrics & Alerts Reference.
Data
To view metric charts for business data, select the Metrics tab and refer to the Data area. These charts provide a snapshot of the cluster's entity data by indicating the number of collections, entities, and loaded entities in the cluster. For a quick overview of available metrics, refer to Metrics & Alerts Reference.