Analyze Cost
The Usage page in Zilliz Cloud provides you with a visualized cost analysis tool, enabling you to view and track Zilliz Cloud usage and expenses from multiple dimensions.
Prerequisites
To access and analyze costs via the Zilliz Cloud usage page, you must have Organization Owner or Billing Admin permissions.
Procedures
There are two ways to analyze costs on Zilliz Cloud.
-
Via Web UI: If you need to visualize the cost trends, we recommend using the web UI. Usage details on the web UI are rounded to 10 decimal places.
-
Via RESTful API: If you need more detailed insights into the daily usage, we recommend using the RESTful API. Usage details obtained from the RESTful API are precise to 10 decimal places.
Via Web UI
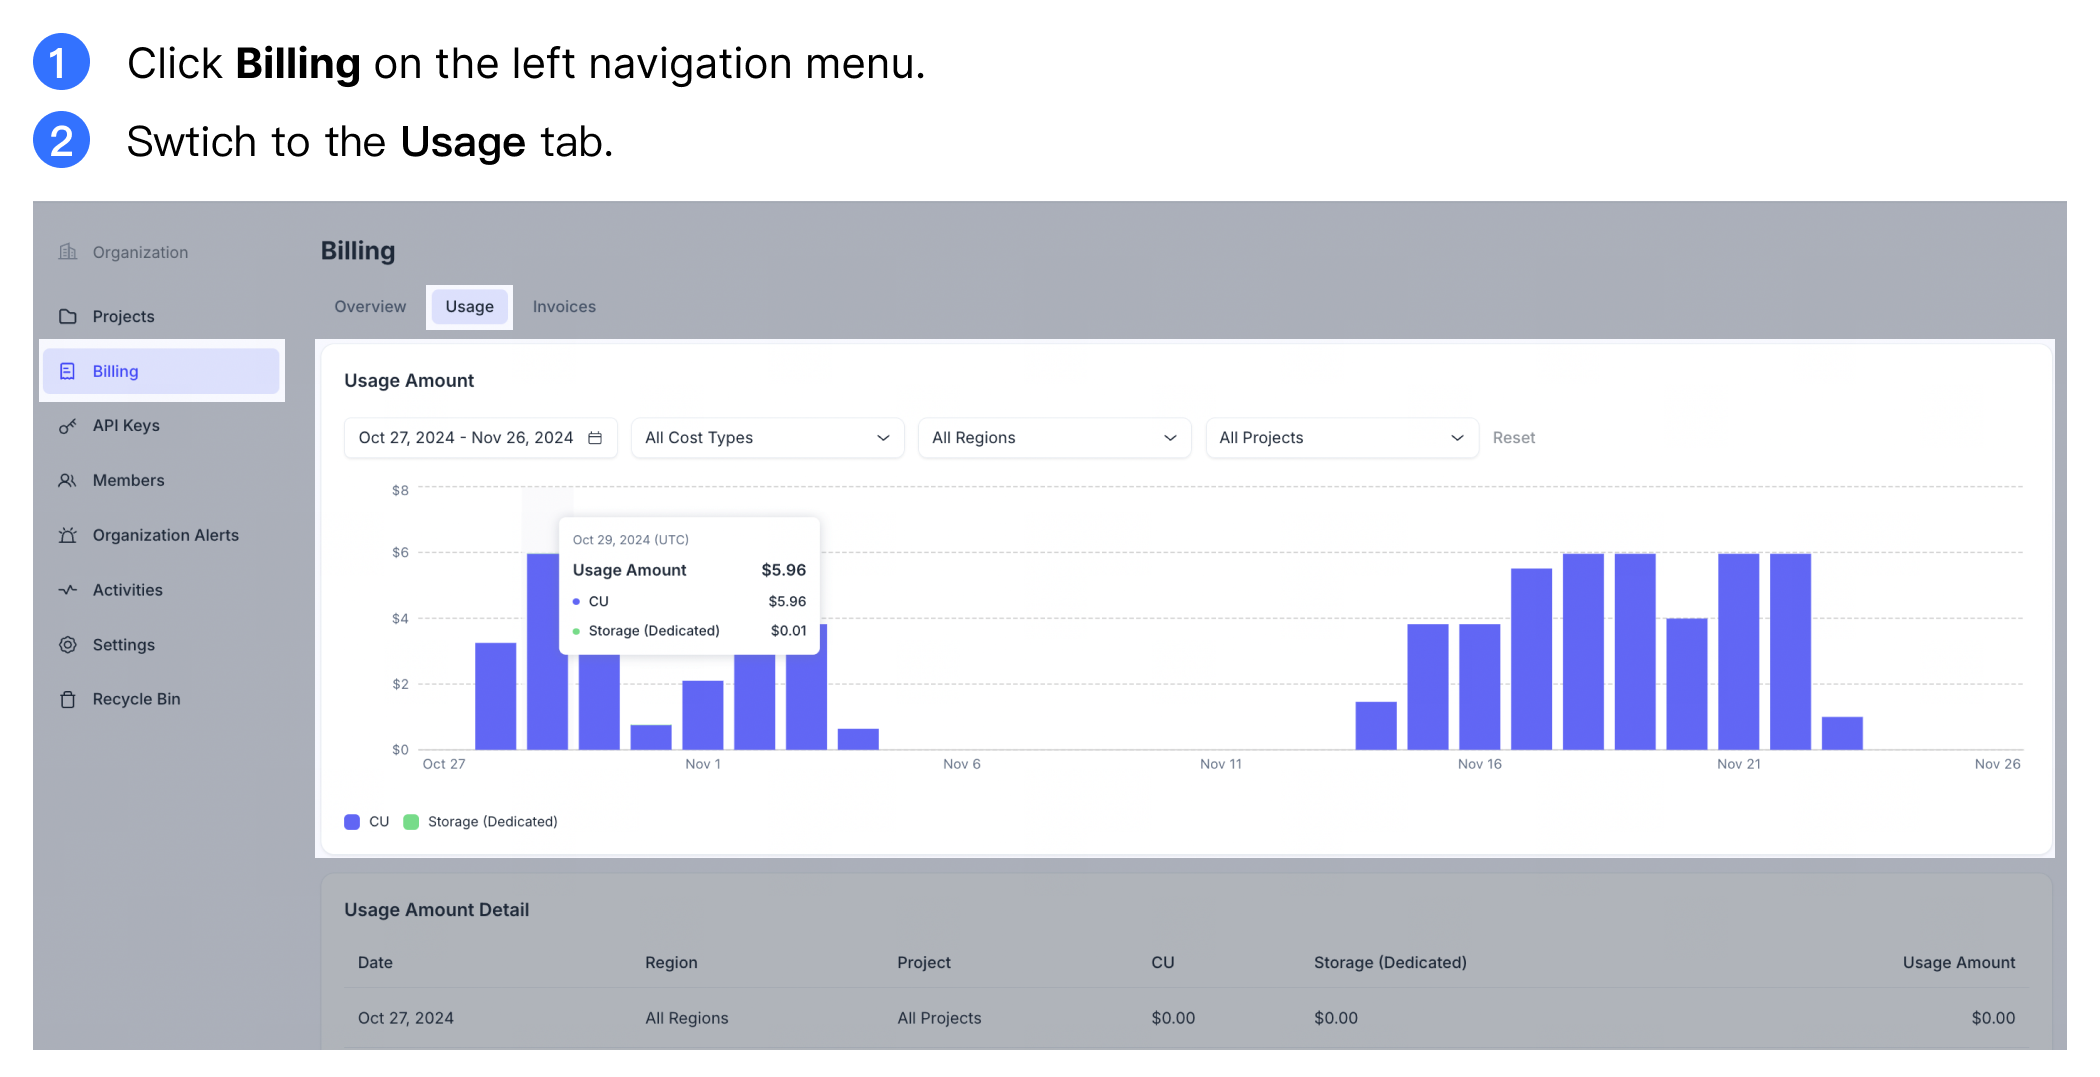
On the Billing page, switch to the Usage tab. You can monitor the usage and cost trends across various dimensions.
Usage data is updated on an hourly basis.

-
By Project
If you have created multiple projects for different businesses or departments, you can filter and view usage and costs for a specific project.
For example, if you have created two projects, Default Project (for the R&D department) and Project_01 (for the Marketing department), you can select Default Project in the project filter to analyze the R&D department's usage and costs over the past month.
The Usage Amount bar chart will visually represent daily usage changes, and the Usage Amount Details table provides data in tabular form.
-
By Cluster
If you have created multiple different clusters based on your business, you can filter and view the specific usage and cost of a particular cluster according to the clusters.
For example, if you have created two different clusters for user information and order information respectively, when you need to check the usage and cost of the cluster storing order information, you can select the corresponding cluster in the filter.
-
By Time Period
To review usage and cost trends over a specific time range, you can select a time period in the filter.
The default time range is 1 month, with a maximum span of 2 months.
For instance, to analyze daily usage and expenses for August 2024, select August 1, 2024 to August 31, 2024 in the date filter. The Usage Amount bar chart will display daily cost trends for the selected time frame.
-
By Cost Type
To examine usage and cost trends for a specific cost type, you can select the desired billing item in the filter.
Available cost types include CU Costs, Write Costs, Read Costs, Storage Costs (Serverless), Storage Costs (Dedicated), Backup Costs, and Pipelines Costs.
For example, to analyze total backup costs across all projects over the past month, select Backup Costs in the cost type filter. The Usage Amount bar chart will show the total daily backup costs for the selected time range.
-
By Cloud Region
If you have deployed services across multiple cloud regions, you can filter by cloud region to view region-specific usage and costs.
For instance, if you deployed clusters in both AWS us-east-1 (Virginia) and GCP europe-west3 (Frankfurt), you can filter and view usage and costs for the AWS us-east-1 (Virginia) region.
You can combine multiple filters based on your analysis needs to view visualized usage and cost data. For example, you can filter by project, time period, cost type, and region to gain a comprehensive understanding of your usage trends and costs.
Via RESTful API
The Query Daily Usage RESTful API is currently in public preview. To use this API, please contact us.
You can also use the Query Daily Usage API to query the daily usage of an organization. Usage details you get from this RESTful API are precise to 8 decimal places. If you need to understand how daily costs are accumulated and rounded to 2 decimal places, we recommend using the RESTful API. By adding up the daily usage, you will obtain a total usage amount that is precise to 8 decimal places. Then round this total usage amount to 2 decimal places (eg. 60.57). The final total usage amount should be consistent with the figured displayed on your invoice.
The following example demonstrates how to query the daily usage of an organization.
curl --request POST \
--url "https://api.cloud.zilliz.com/v2/usage/query" \
--header "Authorization: Bearer ${TOKEN}" \
--header "Content-Type: application/json" \
-d '{
    "start": "2024-01-01",
    "end": "2024-02-01"
}'
In the command above,
-
start: The start time of the query period, in the format ofYYYY-MM-DD. -
end: The end time of the query period, in the format ofYYYY-MM-DD.
FAQ
How precise are the amounts displayed in the usage details on Zilliz Cloud?
Zilliz Cloud calculates charges with a precision of 10 decimal places, and all billing is computed to this level of accuracy. Daily charges are first calculated to 10 decimals, then summed and rounded to 10 decimals during the billing process.
-
RESTful API: All numeric values (e.g., Unit Price, Usage, Usage Amount) are always returned with exactly 10 decimal places. If the value has fewer than 10 decimal digits, trailing zeros are padded to reach 10 digits. For more information about how to use the RESTful API, see Query Daily Usage.
-
Web Console UI: The displayed amounts are consistent with the API values, but trailing zeros are omitted for readability. For example,
0.1234000000would be displayed as0.1234in the UI.